We’re excited to share A Year in Review (leer en español) that shows the impact of Best Starts funding through highlights drawn from the 2025 Best Starts for Kids Annual Report.
In 2025, Best Starts partnered with 376 community-based organizations operating 614 programs to directly serve 167,978 children, youth, and caregivers. Best Starts also reached another 119,080 community members through activities and supported 1,637 members of the early childhood and child care workforce across King County.
Best Starts invests in eight areas, including Child Care, Investing Early, Sustain the Gain, Youth and Family Homelessness Prevention Initiative, Communities of Opportunity, Capital Projects, Technical Assistance and Capacity Building, and Data and Evaluation. Across these investment areas, Best Starts results in 2025 fall into five focus areas:
- Meeting Families’ Needs to support families’ safety and stability.
- Prioritizing Well-being and Mental Health to support the family unit and the whole community.
- Cultivating Opportunities for Children and Young People to support their goals in education and employment.
- Strengthening the Workforce to support a sustainable, robust, skilled, and well-compensated workforce to meet the needs of babies, children, and families.
- Building Community Power and Capacity to support long-term equitable systems change and organizational infrastructure.
Check out the 2025 Data Dashboard!
The Best Starts for Kids 2025 Data Dashboard provides additional measures for Best Starts for Kids programs, customizable data views, and greater geographic and financial detail organized by section and investment area. Readers can navigate by clicking the gray navigation bar at the top of the dashboard. In many sections, readers can select specific strategies, programs, or topics of interest via a dropdown menu beneath the list of investment areas.
The Best Starts for Kids Dashboard includes the following sections:
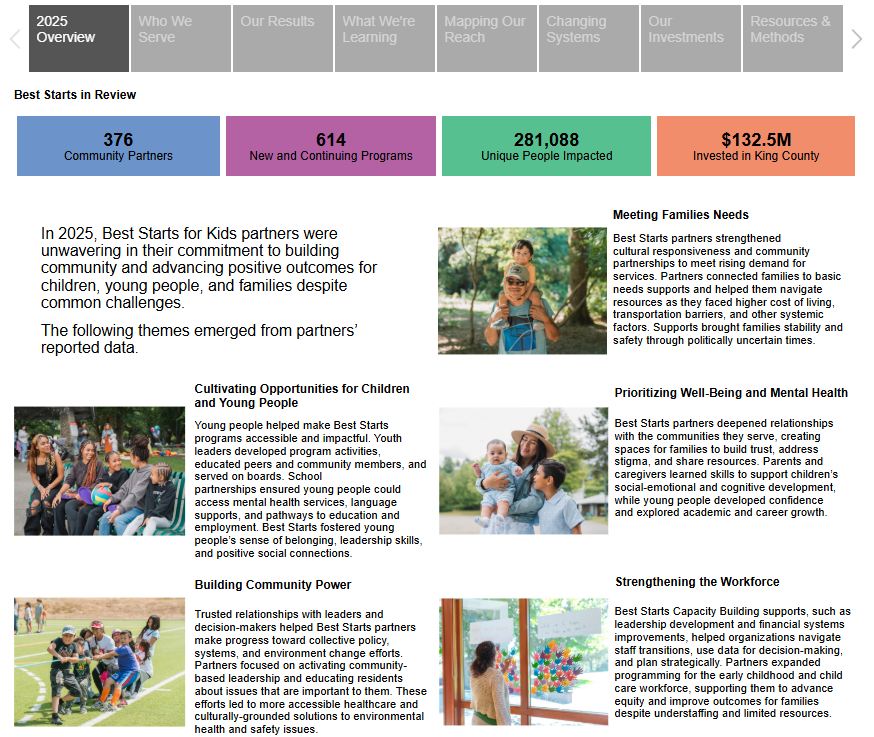
2025 Overview: Provides a summary of numbers and themes across Best Starts’ investment areas.
Who We Serve: Provides information on communities served by race, gender, and age, organized by program, strategy, and investment area.
Our Results: Provides information on the quantity, quality, and outcomes of Best Starts, organized by strategies and programs within each investment area.
What We’re Learning: Provides initiative-wide thematic information from community partners about successes, challenges, changes, and impact stories.
Mapping Our Reach: Provides information on Best Starts’ reach geographically within King County, organized by investment areas that enroll individual participants.
Changing Systems: Provides information on how Best Starts invests in policy, systems, environment, and organizational change.
Our Investments: Provides fiscal data, including terminology and notes. The fiscal table is organized by investment area with breakdowns by strategy.
Resources & Methods: Provides information on data collection, in-depth evaluation, methods, population indicators, and considerations.